AMC 10 · 2024 · #12
Grade 6 arithmeticProblem
Zelda played the Adventures of Math game on August 1 and scored points. She continued to play daily over the next days. The bar chart below shows the daily change in her score compared to the day before. (For example, Zelda's score on August 2 was points.) What was Zelda's average score in points over the days?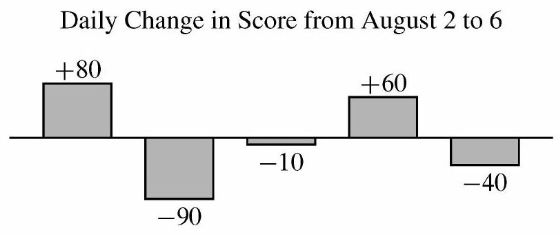
Pick an answer.
Toolkit + CCSS Solution
Understand
Restated: Zelda's score on August 1 is $1700$ points. On each of the next $5$ days a bar chart gives the change from the previous day: $+80, -90, -10, +60, -40$. Find her average score over the six days, August 1 through August 6.
Givens: Day 1 score: $1700$; Daily changes (Aug 2 through Aug 6): $+80, -90, -10, +60, -40$; Each day's score = previous day's score + that day's change; Answer choices: (A) $1700$, (B) $1702$, (C) $1703$, (D) $1713$, (E) $1715$
Unknowns: The average of the six daily scores
Understand
Restated: Zelda's score on August 1 is $1700$ points. On each of the next $5$ days a bar chart gives the change from the previous day: $+80, -90, -10, +60, -40$. Find her average score over the six days, August 1 through August 6.
Givens: Day 1 score: $1700$; Daily changes (Aug 2 through Aug 6): $+80, -90, -10, +60, -40$; Each day's score = previous day's score + that day's change; Answer choices: (A) $1700$, (B) $1702$, (C) $1703$, (D) $1713$, (E) $1715$
Plan
Primary tool: #2 Make a Systematic List
The data arrives one day at a time and the rule "next score = previous score + change" is purely sequential, so Tool #2 (Make a Systematic List) is the cleanest fit: walk down the days in order, write each score, then apply the mean formula to the finished list. With only six entries there is no need to reach for algebra (Tool #13) or a shortcut formula — keeping the list visible also makes the answer easy to audit.
Execute — Answer: E
6.NS.C.5 Step 1 - Build the list of daily scores.
- Start with Aug 1 = $1700$ and add each day's signed change in order.
- Working left to right keeps the running total honest.
💡 A signed daily change is exactly the Grade 6 "positive and negative quantities in real-world contexts" idea: $+80$ means up $80$, $-90$ means down $90$. Add them to the running total in order.
4.NBT.B.4 Step 2 - Add the six scores to get the total.
- Pair the values to make the arithmetic easier: $1700 + 1700 = 3400$, $1780 + 1740 = 3520$, and $1690 + 1680 = 3370$.
💡 Pairing endpoints with middle values keeps the partial sums round and easy to check — a Grade 4 multi-digit addition habit.
6.SP.B.5 Step 3 Divide the total by the number of days to get the average score.
💡 Average $=$ sum $\div$ count. With $6$ scores summing to $10290$, dividing gives $1715$ exactly.
6.NS.C.5 Build the list of daily scores. Start with Aug 1 = $1700$ and add each day's sig 4.NBT.B.4 Add the six scores to get the total. Pair the values to make the arithmetic easi 6.SP.B.5 Divide the total by the number of days to get the average score. Review
Reasonableness: Sanity check the magnitude. All six scores sit between $1680$ and $1780$, so their average must land in that band — and $1715$ does. A second check: the net change from Aug 1 to Aug 6 is $80 - 90 - 10 + 60 - 40 = 0$, so Aug 1 and Aug 6 both equal $1700$, which the list confirms. Finally, $1715 \times 6 = 10290$ recovers the total, closing the loop.
Alternative: Tool #15 (Organize Information in More Ways): instead of listing the six scores, write the total as six copies of $1700$ plus the carry-forward of each change. The Aug 2 change of $+80$ is felt on $5$ later days (Aug 2 through Aug 6), Aug 3's $-90$ on $4$ days, Aug 4's $-10$ on $3$, Aug 5's $+60$ on $2$, Aug 6's $-40$ on $1$. So total $= 6 \times 1700 + 5(80) + 4(-90) + 3(-10) + 2(60) + 1(-40) = 10200 + 400 - 360 - 30 + 120 - 40 = 10290$, and the average is $10290 / 6 = 1715$. Same answer (E), no need to compute the six daily scores separately.
CCSS standards used (min grade 6)
6.NS.C.5Understand that positive and negative numbers describe quantities having opposite directions or values (Interpreting each bar of the chart as a signed daily change ($+80$ raises the score, $-90$ lowers it) and applying it to the running total.)4.NBT.B.4Fluently add and subtract multi-digit whole numbers using the standard algorithm (Summing the six four-digit daily scores ($1700 + 1780 + 1690 + 1680 + 1740 + 1700 = 10290$) using friendly pairings.)6.SP.B.5Summarize numerical data sets, including reporting the number of observations and measures of center (Computing the arithmetic mean of the six daily scores: $10290 \div 6 = 1715$.)
⭐ When data comes from a chart, list the values first and average second. Pair the addends to keep the partial sums tidy, and use the net change as a quick sanity check on your list.
⭐ When data comes from a chart, list the values first and average second. Pair the addends to keep the partial sums tidy, and use the net change as a quick sanity check on your list.